We always encourage new customers to A/B test our service (i.e. when half of the traffic is given the original search engine and half are given the Loop54 engine). We love having the additional proof points about our service, and as of yet we have never lost a fight.
Unfortunately, setting up a proper A/B split test to measure the effects of a new search engine can be difficult for some eCommerce retailers. Especially for those that haven't worked with split testing in the past.
Most eCommerce retailers just want a reasonable and objective-ish way to measure the impact of their new or updated product search engine. They want something that helps them measure the ROI on their site search investment.
In this situation, we give our customers the following guidelines.
Research Method
Analysing the effect of a change in functionality without running a proper A/B test can be tricky since it involves comparing the performance of a website today with how it performed during a previous period. Moreover, there is no way of controlling all noise in the data, such as seasonality, changes in marketing efforts and so on.
To mitigate this problem, an assumption can be made that the performance change of non-searching visitors between two periods of time acts as a reference as to how one would expect the performance of searching visitors to change during the same period.
For example (this is only an example, not actual data):
- Non-searching visitors in Period B convert 10% more often than non-searching visitors in Period A.
- Searching visitors in Period B convert 5% more often than searching visitors in Period A.
- One can then draw the conclusion that the change made has had a negative effect on the conversion rate since the expectation was for a 10% increase, not 5%.
In order to remove as much noise as possible from the analysis and to make a more fair comparison is to remove bouncing visitors.

The reason you want to remove bounces is because it heavily waters down the conversion rate of the non-searching visitors, espeically if you happen to have high a bounce-rate in one period but not another. It can also give skewed picture of searching visitors, paricularly if you are doing Paid Ads that point directly to search results pages. So best is to remove bounces from both segments (searching and non-searching visitors).
Generally, make sure the distribution of traffic sources is the same for the time periods you are comparing, if one time period has more traffic from a particular source than another this can influence the results, since visitors from difference sources behave differently.
Removing bounces will often show you that the difference in conversion rate between non-searching visitors and searching visitors gets smaller (for example: without removing bounces, searching visitors may convert 4x higher than non-searching. But when removing bounces, search visitors only convert 2x more). This is usually a more useful comparison to make in situations when comparing searching visitors with non-searching visitors.
How to measure the impact of a new or updated product search engine:
-
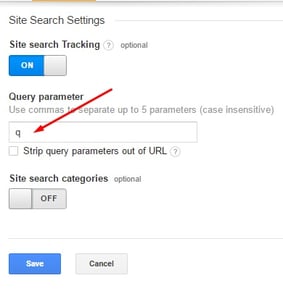
First, tell Google Analytics what a session with search looks like. Follow these instructions or this blog post on how to do that. Hint: it’s under Admin -> View Settings
-
Then, once that's done. Create a Session Segment called “Non-Bounce Sessions”.

-
Then, using this segment, navigate to the Google Analytics section Behavior —> Site Search —> Usage. It’s this report, with two time periods (i.e. before and after you implemented/changed your search engine) that you can measure the effects of that change.


Example of how this analysis looked for one of our customers recently - after going live with Loop54 on August 26th, 2016:

The conversion rate for non-searching visitors decreased from 4.24% to 3.71% (-12.33%). This is the reference to use as to what would be expected to happen to searching visitors.
However, the conversion rate for searching visitors increased from 6.77% to 7.55% (+11.4%) - which is a considerable increase considering the reference point.
Therefore, if its expected that searching visitor conversion rate would decrease 12.33%, but it actually increased 11.4%, the net effect of the new search engine is actually an increase of +27.07%.
It also shows that the value per session for non-searching visitors increased from 31.49kr to 33.13kr (+5.21%), while the change for searching visitors went from 55.79kr to 73.03kr (+30.9%). Therefore, the net effect of the new search engine was an increase of 24.42% ((1+30.9%)-(1+5.21%))/(1+5.21%).
Read more case studies on how site search increases conversion rates.