Many of today's e-commerce organisations are following their revenue streams using emailed reports and dashboards. But, while internal site-search is regarded as a very important feature on the site, it is rarely included and evaluated in these reports. On-site product search reports provide in-depth analysis into search results, sessions, exits and revenue. Using tailored visualisation reports, organisations can filter site-search data by traffic source and device, generating actionable insights and driving sales.
What Should I Track on a Site Search Performance Report?
What do you want to accomplish with your site-search and what KPIs are important to act upon? The most important question for any e-commerce business is normally whether or not the search results are helping the online purchases. Therefore, you should begin with setting up revenue related KPIs, segmented site-search status (sessions with or without search). We recommend looking at revenue, conversion rate and average order, or else use the revenue KPIs that you are already following in other reports. In addition, we also suggest segmenting them on device category (mobile/tablet/desktop) or incoming channel, as this provides useful platform insights.

What Can My Search Data Tell Me About My Buyers?
The conversion rate for users who are searching is typically higher than for other users, since a search indicates higher purchase intent in the user and a deeper stage of the buyer's journey. Now, look at your KPIs – is the conversion rate of users who are using the search function roughly double that of non-searchers, or is it lower? If it's lower, then it's time to ply your UX team with a lot of strong coffee and send them off to talk to users and figure out how to improve the search user experience – are the results not good enough, are the facets hidden or does the autocomplete lead them to empty result pages? Perhaps there is an opportunity for an A/B test on the search box?
Another way of seeing if the user is satisfied with the site-search is analysing search exit rates – that is, how many users perform a search but then leave the site. These search metrics are as important to search performance as bounce rate is for landing pages. Do you have a high search exit rate, or is there a negative trend considering the last time period? Understanding intent and long-tail keywords is vital to on-site search.
To answer these questions, you need to dive into your list of keywords with the highest exit rates and the list of keywords with no resulting hits.
- If your users are searching on an attribute (such as age or size) that is not currently searchable, make it searchable.
- If they expect you sell products outside your current range, increase your product range.
- If your prices are set too high compared to competitors, set up price matching.
- And if they are searching for a yearly trend (such as "easter feathers") that is not available yet, pluck those hens fast.
You need to see if you can identify any buyer expectations that are not yet being fulfilled and begin the fulfilment process as quickly as possible.
You should also have a look at the percentage rate of sessions with search, especially if you make changes on your site. The percentage of sessions with search are unlikely to be instantly affected by a change in the search results (although you might see trends over time after the returning users learn if your search results are useful or not) but might change drastically if you make UX changes to your navigation or search boxes.
How Can I Measure Search Engagement?
Google Analytics offers multiple search engagement metrics, such as browsing time after a search, results from page-views/search, search refinements, time after search and search depth (read more about how they are calculated here). These are all interesting to look at but somewhat ambiguous: for example, a user with a large time after search can either be contently reading about product specifications or else close to tears while trying to find the product they were looking for. These metrics might, therefore, be interesting to look at for bigger trends but will be difficult to work with otherwise.
Get the Data Studio Template
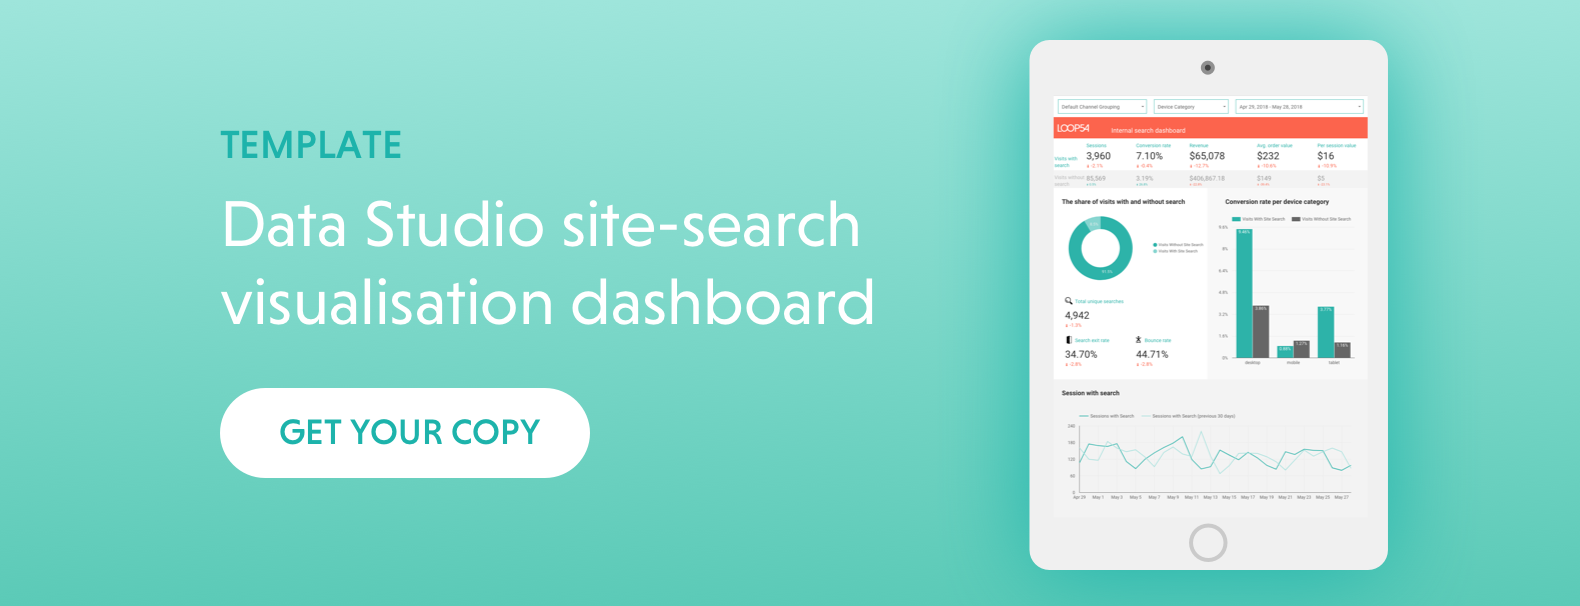
Here at Loop54, we have created a site-search visualisation template using Google Data Studio. The dashboard will show you:
- Sessions with/without search
- Revenue with/without search
- Top terms searched
- Percentage of search exits
- Top terms searched, with a high percentage of search exits
- Data filtering by traffic source and device
Get started today! Evaluate your site-search with live KPIs and metrics.